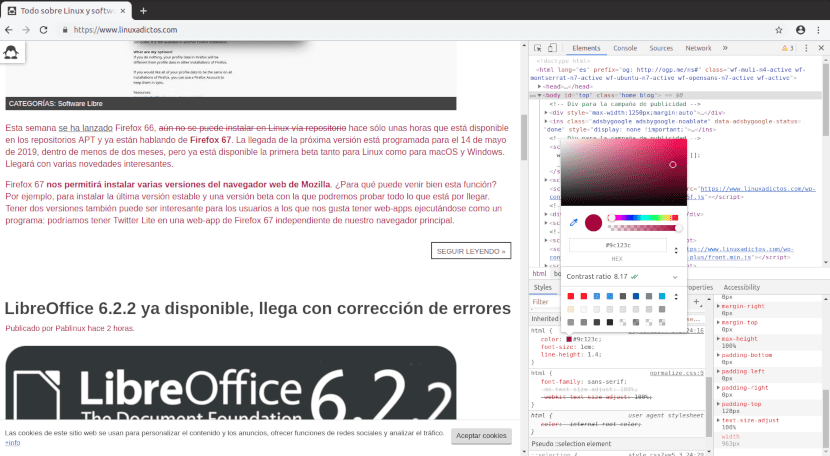
With the Chrome DevTools we can immediately see the effects of the modifications in the code
Chrome DevTools is a set of website creation and debugging tools built into Google Chrome. Of course, we can also use them in its open source version; Chromium.
It is possible to access the Chrome tools for developers by pressing the key combination Ctrl + Shift + I, also by hovering over an element and right-clicking on Inspect.
Alternative
When we open Chrome DevTools we see that u appearsn panel to the right of the page we are browsing. For its part, this panel eIt is divided into tabs corresponding to each of the tools. In turn, the tools are divided into sections.
The sections are:
- Elements: Shows the different components of the page.
- Console: Allows you to run diagnostics during development or interact with the Javascript code as you would with the Linux terminal.
- Sources: Makes it easy to debug Javascript code and work with local files.
- Network: Helps monitor and improve page performance.
- Timeline: Allows the recording and exploration of the different events that occur during the visit to a site.
- Application: Investigates all the resources that are loaded; among others, IndexedDB or Web SQL databases, local and session storage, cookies, app cache, images, fonts, and style sheets.
- Security: Detects security problems in the code.
Let's see what we can use Chrome DevTools for
Fix what doesn't work
It has happened to every developer. Write the code, check that there are no errors, and yet at the moment of truth the page does not work as it should. The Console tool shows what error is occurring at execution time.
Decrease loading time
If a page takes a long time to load, the user gets tired and goes to another site. Fortunately, the era of Flash websites and their animated intros are over. Anyway the Networks tab of the Chrome DevTools makes it easier to discover which elements are delaying the load. We can repeat the test for different connection speeds.
Modify the code
In the Elements tab we can see the elements of a page, the related html code and the css properties. We can also change them.
We can edit the text of a page using the command
document.designMode = 'on';
Try different screen sizes
Tablets, smartphones, smart TVs, desktop computers. The list of devices with which we surf the Internet is growing. With Chrome DevTools we can test whether a page looks good at different sizes.
Benchmarking
In Management the term benchmarking means learning from the best practices of those who do the same as us. With Chrome DevTolls, if we like the design of a website we can view the html code and css stylesheets and copy them to our site.
Getting Chrome DevTools
Chrome DevTools is available on the Google Chrome and Chromium browsers. Chromium is in the repositories of the major distributions. It can also be installed from stores Snap. As for Google chrome you can get here. in DEB and RPM format