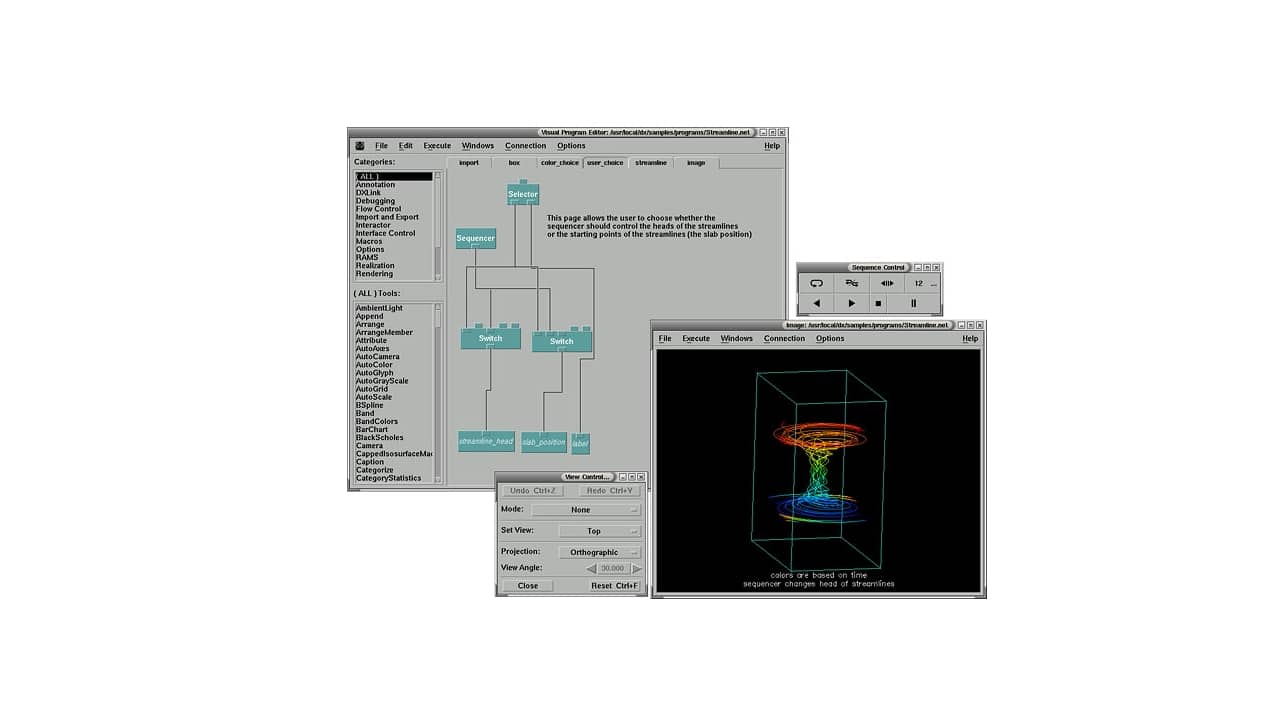
IBM has developed this interesting software that you may not have known about, but that can help you visualize scientific data graphically. His name is OpenDX (Open Data eXplorer) and is licensed under the IBM Public License. In addition, it is available for GNU / Linux, and you can find it in the official repos of some distros, or in the app stores to install it easily.
Can handle complex domains, such as the data of mechanical gear systems, human brain, measurements, computed data of advanced systems, etc. All these data can be scalar (such as the concentration of chemical substances), vector or tension fields (such as displacement, ...) at the different points of the object.
The points at which this data is measured need not be evenly spaced, they may not be evenly spaced. In either case, the OpenDX output will be a 3D images with color-coded or grayscale values, or vectors, flow lines, etc. It even supports cutting sections for better inspection, rotating objects to provide the data view from any angle, animating on the move, and more.
Its graphical interface has a series of functions to interact with. For example, you can directly manipulate the generated images by zooming, rotating, etc. And you can also use other indirect functions with buttons, dials, etc., to control aspects of the display.
In addition, it is quite light, and allows to obtain the results in just 3 easy steps: description and import of the data to be processed (they can come from different sources), data processing through visualization, and presentation of the results in the form of an image.
Although this application is somewhat primitive, I wanted to show you, since it is still used. And, without a doubt, it is another alternative to other similar programs like GID, Paraview, MayaVi, DataMelt, etc.